The yen is depreciating rapidly. This is a side effect of the Shinzo Abe's ``Abenomics.''
円安が急激に進行している。これは安倍晋三による「アベノミクス」の副作用である。
I will explain the side effects in a separate article at a later date. This time, I will explain ``Sonotanomics'', which was created to cover up the failure of ``Abenomics''.
その副作用の説明は後日別の記事でしようと思う。今回は、「アベノミクス」の失敗を覆い隠すためになされた「ソノタノミクス」について説明する。
Sonotanomics refers to the suspicious statistical manipulation that took place during the December 2016 GDP revision.
「ソノタノミクス」とは、2016年12月のGDP改定の際に行われた不審な統計操作のことである。
On December 8, 2016, the Japanese government changed the method of calculating GDP and revised all GDP since 1994.
2016年12月8日,日本政府はGDPの算出方法を変更し、1994年以降のGDPをすべて改定した。
This revision emphasized compliance with the 2008 SNA, the international GDP calculation standard.
この改定で強調されたのは、国際的なGDP算出基準である2008SNAへの対応である。
Previously, Japan's GDP was calculated based on the 1993SNA, but it was changed to the 2008SNA.
以前の日本のGDPは、1993SNAに基づいて算出されていたが、それが2008SNAに変更された。
The government emphasized that this change would increase nominal GDP by about 20 trillion yen compared to before, as research and development expenses would be added.
この変更によって、研究開発費等が上乗せされるため、名目GDPが以前と比べて20兆円程度上がる、という点を政府は強調した。
However, what is more important is that an abnormal adjustment was made to the ``Other'' item, which has nothing to do with the 2008 SNA.
しかし、もっと重要なのは、この2008SNAと関係ない「その他」という項目で、異常な数字の調整がなされた、という点である。
Others is called "sonota" in Japanese. That's why I named this adjustment of numbers "Sonotanomics."
「その他」は、日本語で「sonota」という。だから、私はこの数字の調整を「ソノタノミクス」と名付けた。
Let me emphasize once again that this "Other" item has nothing to do with the 2008SNA and is unique to Japan.
もう一度強調するが、この「その他」という項目は、2008SNAとは全く関係が無く、日本独自のものである。
Now, let's check how much the numbers have changed due to the GDP revision.
では、GDP改定によってどれだけ数字が変わったのか確認してみよう。
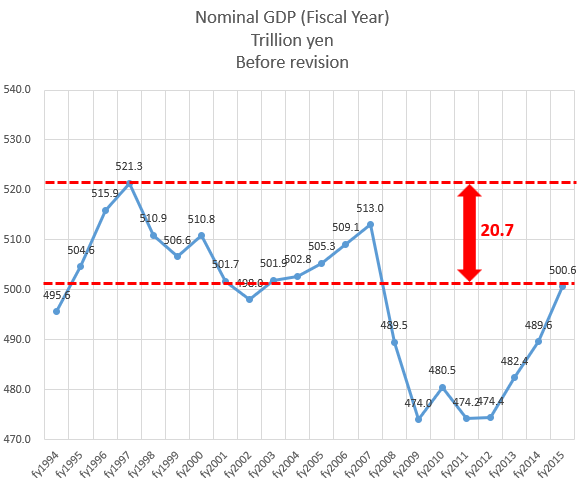
This graph is before revision. The nominal GDP in 2015 was 20.7 trillion yen different from the previous record high in 1997.
このグラフは、改定前のものである。2015年度の名目GDPは,それまでの史上最高値であった1997年度のGDPと20.7兆円も差があった。
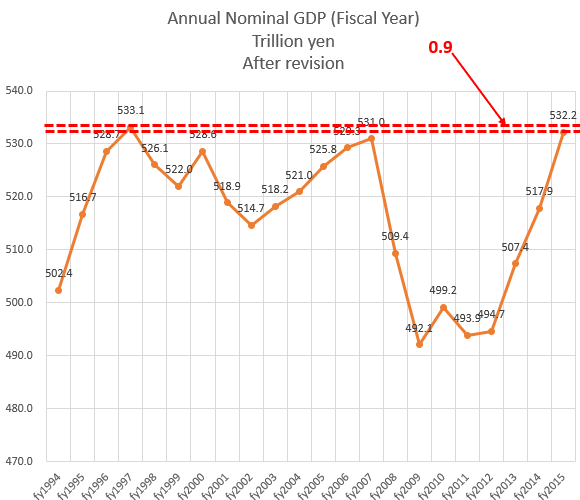
However, the difference after the revision was only 0.9 trillion yen, as shown in the graph below. In other words, the figures for 2015 have almost caught up with the all-time high of 1997.
しかし改定後の差は、次のグラフのとおり、わずか0.9兆円となった。つまり、2015年度の数字が、史上最高値であった1997年度にほぼ追いついた。
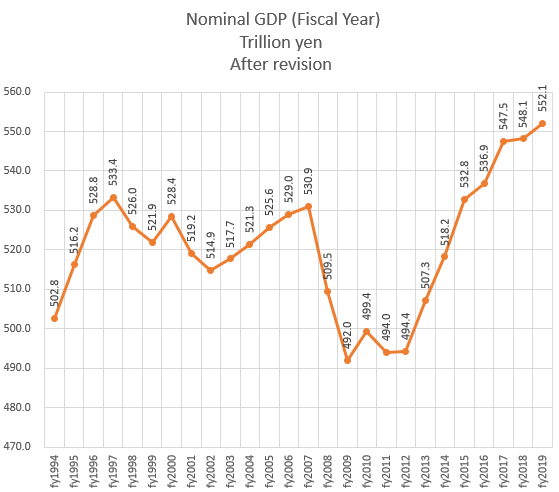
After that, as shown in the following graph, it reached a new all-time high in fiscal 2016, and continued to update its highest value until fiscal 2019, before the outbreak of COVID-19 (for fiscal 2015 and earlier, Figure 2 shows There is a slight deviation from the figures immediately after the revision. This is likely due to minor corrections to the figures.)
その後、次のグラフのとおり、2016年度に史上最高値を更新し、covid-19が流行する前の2019年度までは、最高値を更新し続けた(なお、2015年度以前について、図2で示した改定直後の数値と微妙にずれている。これは数値の微修正を行ったからと思われる)。
Without the GDP revision, it would not have been possible to reach a new all-time high. History has changed.
GDP改定が無ければ、史上最高値の更新はあり得なかった。歴史が変わってしまった。
Now, let's take a look at this graph that shows the difference between GDP before the revision and GDP after the revision.
では、改定前のGDPと、改定後のGDPの差額を抜き出したこのグラフを見てみよう。
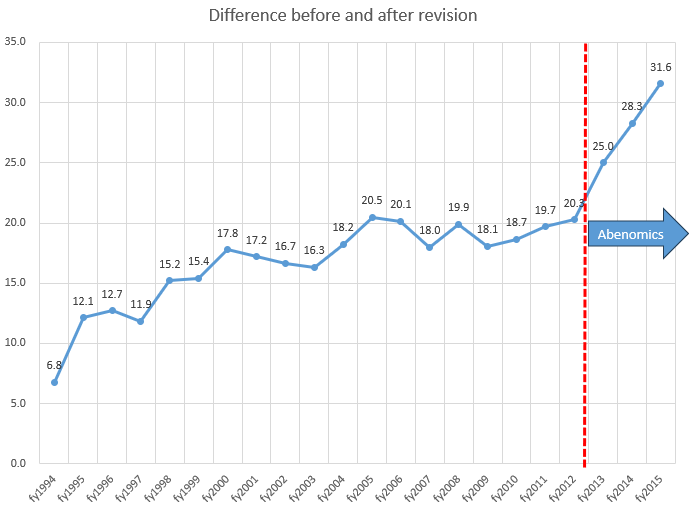
The amount of increase is most noticeable After the start of Abenomics. For example, the 31.6 trillion yen increase in fiscal year 2015 is 1.5 times the amount just before Abenomics (2012).
かさ上げ額は、アベノミクス開始後が突出している。たとえば、2015年度のかさ上げ額31.6兆円は、アベノミクス直前(2012年度)の1.5倍もある。
And if you look at the 1990s, all increases were low. The lowest figure was 6.8 trillion yen in 1994. This is abnormally low compared to 31.6 trillion yen in 2015.
そして、1990年代を見るとかさ上げ額が全て低い。最も低いのは1994年度の6.8兆円である。2015年度が31.6兆円もあるのと比較すると、異常に低い。
The Japanese government has released the table below showing the breakdown of this difference.
日本政府はこの差額の内訳について、下記の表を公表した。
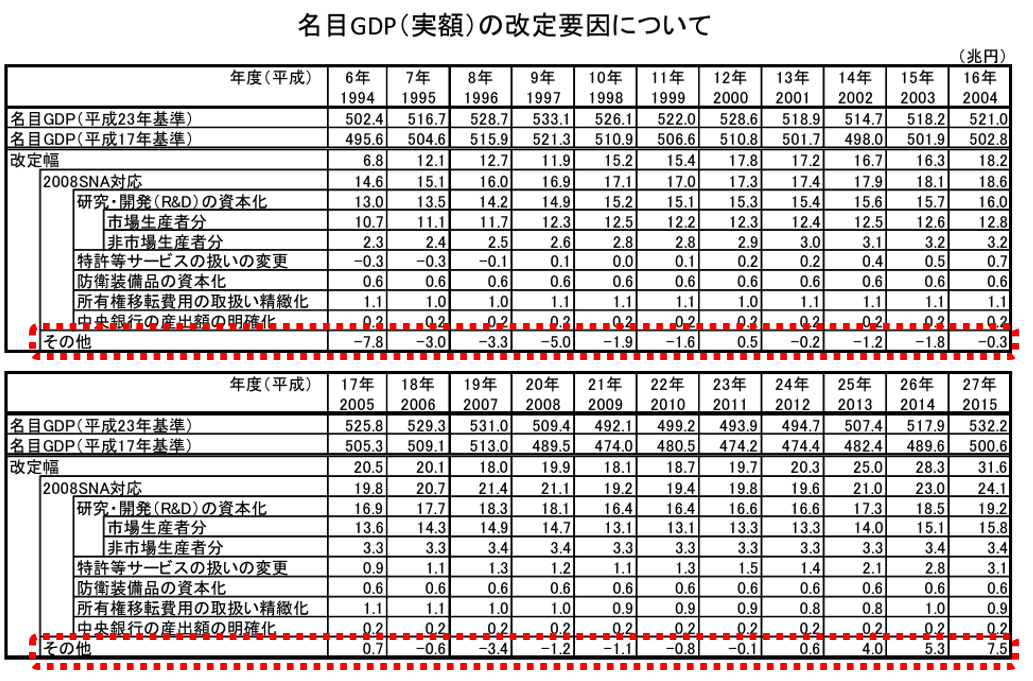
Broadly speaking, there are two reasons: (1) due to 2008 SNA compliance, and (2) other factors.
要因を大きく分けると、①2008SNA対応によるもの②その他、の2つである。
For the 2008SNA compatible part, the breakdown is written in detail, but for the rest there is only one line. In other words, the more detailed breakdown of "other" is unknown.
2008SNA対応部分については、内訳が詳細に書かれているが、その他は1行しかない。つまり、「その他」の更に細かい内訳は不明である。
First, let's look at the amount of increase in the portion corresponding to 2008SNA.
まず、2008SNA対応部分のかさ上げ額を見てみよう。
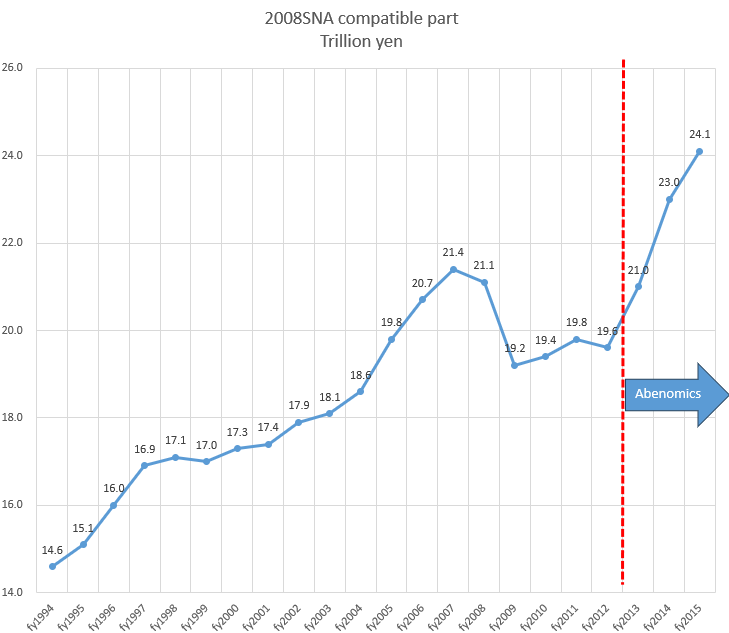
Even though the revision was made based on the same standards, the amount of the increase has been steadily increasing.This is also very unnatural, but the "other" part is even more unnatural. As shown in the following graph.
同じ基準で改定したはずなのに、かさ上げ額が右肩上がりになっている。これも非常に不自然なのだが、「その他」の部分はそれよりもはるかに不自然である。次のグラフのとおり。
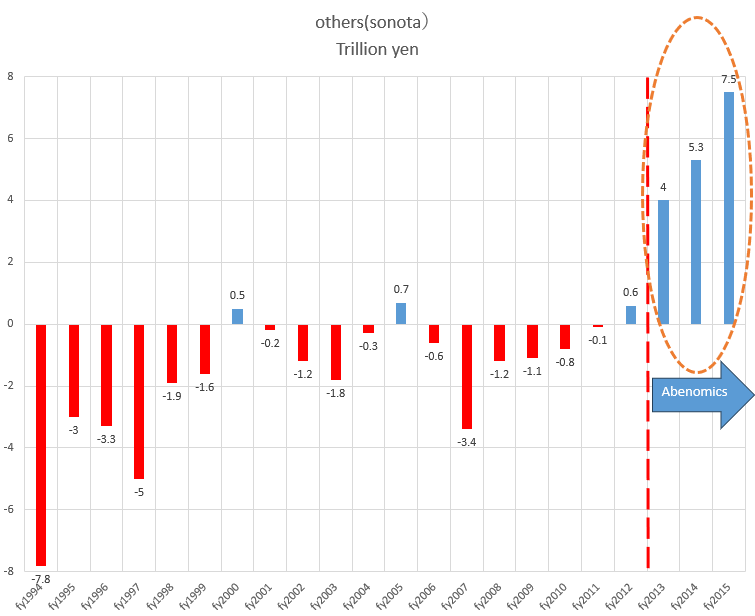
In this way, only the figures after the start of Abenomics have been rapidly inflated. The average increase since the start of Abenomics has been 5.6 trillion yen.
このように、アベノミクス開始後の数値だけが急激にかさ上げされている。アベノミクス開始後のかさあげ平均値は5.6兆円。
On the other hand, the figures for the 1990s are all negative, with the average being minus 3.6 trillion yen.
他方、1990年代の数値は全部マイナスであり、その平均値を出すとマイナス3.6兆円である。
In this way, GDP in the 1990s was significantly reduced, and only GDP after the start of Abenomics was significantly inflated.
このように、1990年代のGDPは大きく下げられ、アベノミクス開始後のGDPのみが大きくかさ上げされている。
This strange adjustment of numbers is called "Sonotanomics."
この異様な数字の調整が「ソノタノミクス」である。
The magnitude of the impact of "Sonotanomics" can be clearly seen by subtracting "Other" from the revised figures. This is the following graph.
「ソノタノミクス」の影響の大きさは、改定後の数値から「その他」を引くとよく分かる。次のグラフである。

In this way, if we subtract "others," the GDP in fiscal 2015 is far from the GDP in fiscal 1997. The difference is 13.4 trillion yen.
このように、「その他」を引いてしまうと、2015年度のGDPは1997年度のGDPに遠く及ばない。その差は13.4兆円もある。
It can be seen that the 2015 GDP has almost caught up with the 1997 GDP due to the large adjustment in the figures for ``Other''.
「その他」で数値が大きく調整されたことで、2015年度のGDPが1997年度のGDPにほぼ追いついたことが分かる。
Japan's nominal GDP was generally higher in the 1990s, and the nominal GDP in 1997 was the highest ever.
日本の名目GDPは、1990年代の方が全体的に高く、その中で1997年度の名目GDPが史上最高値であった。
That nominal GDP in the 1990s was significantly reduced by "Sonotanomics," but after the start of Abenomics, nominal GDP was inflated.
その1990年代の名目GDPが、「ソノタノミクス」によって大きく下げられ、アベノミクス開始後の名目GDPはかさ上げされた。
As a result, nominal GDP reached a new all-time high in 2016.
これによって、2016年度の名目GDP史上最高値更新が達成されたのである。
By the way, where in nominal GDP was the amount inflated by "Sonotanomics" allocated?
ところで、「ソノタノミクス」によってかさ上げされた金額は名目GDPのどこに充てられたのか。
More than half of Japan's nominal GDP is private final consumption expenditure. This is the sum of private consumption expenditure in Japan.
日本の名目GDPの半分以上は民間最終消費支出である。これは日本国内の民間消費支出を合計したものである。
Regarding this nominal private final consumption expenditure, let's look at a graph that shows the difference between the figures before and after the revision and the amount inflated by Sonotanomics.
この名目民間最終消費支出について、改定前と改定後の数値の差額を抜き出したグラフと、「ソノタノミクス」でかさ上げされた額を重ねてみよう。
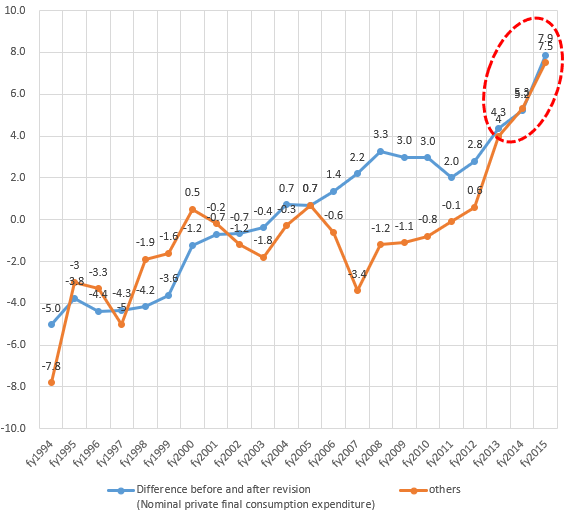
In this way, only after the start of Abenomics, the results have been almost the same for three consecutive years.
このように、アベノミクス開始後のみ、3年度連続でほぼ一致する。
Therefore, the inflated numbers in Sonotanomics appear to have been allocated to private final consumption expenditures.
したがって「ソノタノミクス」でかさ上げされた数値は、民間最終消費支出に充てられたように見える。
Private final consumption expenditure was a figure that symbolized the failure of Abenomics.
民間最終消費支出は、アベノミクスの失敗を象徴する数字であった。
Before the revision, real private final consumption expenditure, excluding the effects of price fluctuations, had fallen for two consecutive years from fiscal 2014 to fiscal 2015. This was the first abnormal situation since the Pacific War.
改定前、物価変動の影響を除いた、実質民間最終消費支出は、2014年度から2015年度にかけて、2年度連続で下落していた。これは、太平洋戦争後初の異常事態であった。
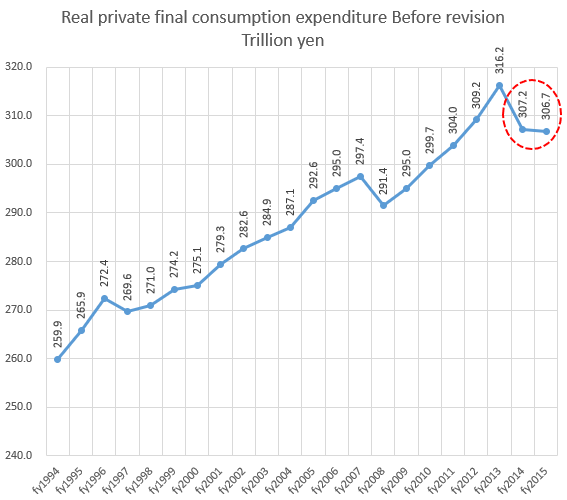
This is due to the consumption tax increase in fiscal 2014, as well as the rapid depreciation of the yen due to Abenomics.
この原因は、2014年度に消費税を増税したことに加え、アベノミクスによって急激に円安を進行させたからである。
Real wages plummeted because nominal wages could not keep up with the rise in prices. Let's take a look at its progress.
物価の上昇に名目賃金が追いつかなかったため、実質賃金が急落した。その推移を見てみよう。
This is an index of nominal wages, real wages, and consumer prices, with 2012 (just before the start of Abenomics) set at 100.
これは、2012年度(アベノミクス開始直前)を100とした、名目賃金、実質賃金、消費者物価の指数である。
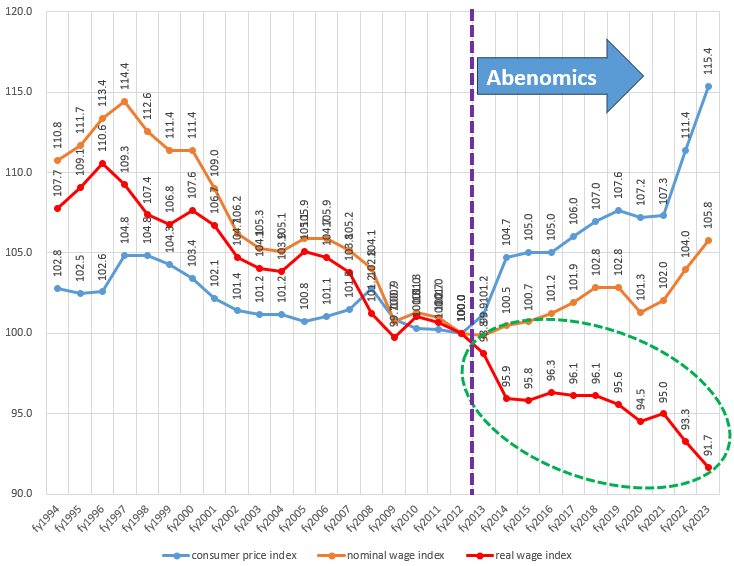
This sharp decline in real wages directly led to a decline in consumption, and real private final consumption expenditure fell for the second consecutive year.
この実質賃金の急落が消費の落ち込みに直結し、実質民間最終消費支出が2年度連続で下落したのである。
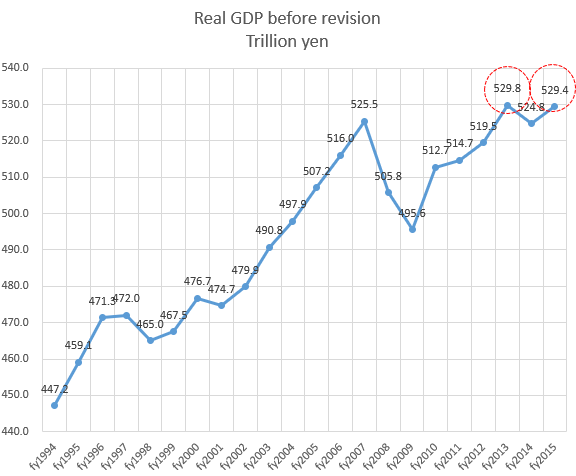
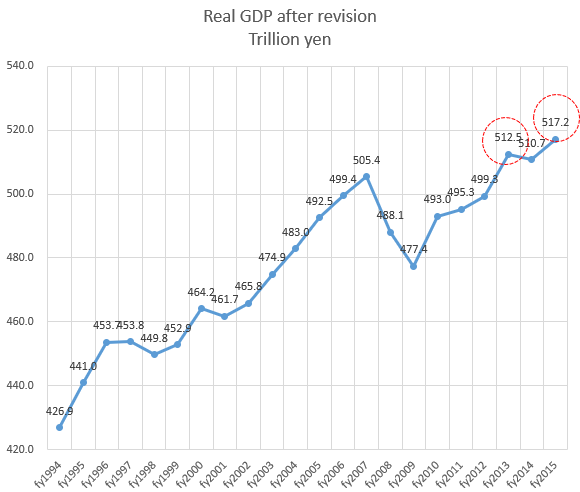
This drop in real private final consumption expenditure had a major impact, and real GDP in FY2015 was lower than that of FY2013. The phenomenon of "real GDP falling below that of two years prior" was also the first abnormal situation since the Pacific War.
この実質民間最終消費支出の下落が大きく影響し、2015年度の実質GDPは、2013年度の実質GDPを下回った。「実質GDPが2年度前を下回る」という現象も、太平洋戦争後初の異常事態であった。
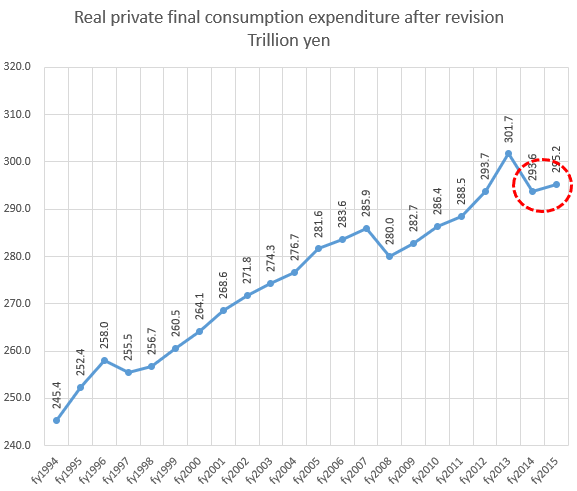
However, when looking at the revised real private final consumption expenditures, the figures for fiscal 2015 exceeded those for fiscal 2014, and the abnormal phenomenon of ``a decline for two consecutive years'' has disappeared.
ところが、改定後の実質民間最終消費支出を見てみると、2015年度の数値が2014年度の数値を上回っており、「2年度連続で下落」という異常現象が消滅した。
And the phenomenon of "real GDP falling below that of two years ago" has also disappeared.
そして、「実質GDPが2年度前を下回る」という現象も消滅した。
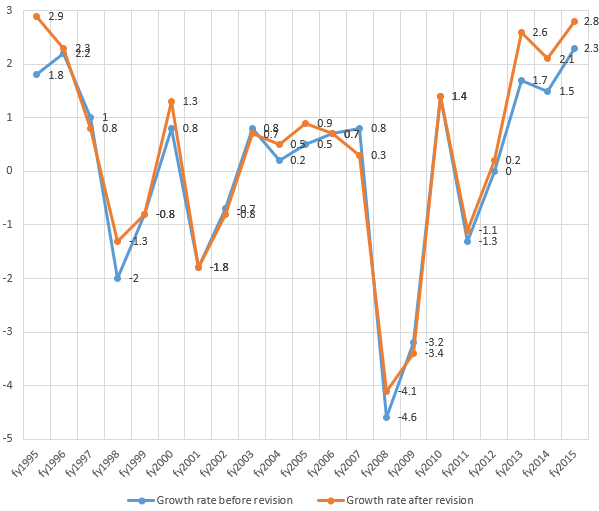
The growth rate was also inflated. Before the revision, the average annual growth rate of nominal GDP in the three fiscal years since the start of Abenomics was about 1.8%. After the revision, it became about 2.5%.
また、成長率もかさ上げされた。改定前、アベノミクス開始後の3年度の名目GDP年度平均成長率は、約1.8%であった。改定後は、それが約2.5%になった。
If this growth rate is maintained, nominal GDP will reach 600 trillion yen in fiscal 2020. (532.2×1.025×1.025×1.025×1.025×1.025≒602.2)
この成長率を維持した場合、2020年度に名目GDP600兆円を達成することになる。(532.2×1.025×1.025×1.025×1.025×1.025≒602.2)
Mr. Abe has publicly announced his goal of ``achieving a nominal GDP of 600 trillion yen by fiscal 2020.''
そして、安倍氏は「2020年度を目途に名目GDP600兆円達成」という目標を公言していた。
This GDP revision appears to be tailored to Mr. Abe's goals.
このGDP改定は、まるで安倍氏の目標に合わせたもののように見える。
However, due to the impact of the COVID-19 pandemic, the nominal GDP of 600 trillion yen has not yet been achieved.
しかし、covid-19流行の影響もあり、名目GDP600兆円は未だに達成されていない。
Regarding the breakdown of ``Others'', ``numbers close to the breakdown'' were released more than a year after the GDP revision.
「その他」の内訳については、GDP改定から1年以上も経過した後に「内訳に近い数字」が公表された。

Even if the published numbers are added up, they do not add up to "other." Therefore, it is just a figure that is "close to the breakdown."
公表された数字を合計しても「その他」と一致しない。したがって、あくまで「内訳に近い」数字に過ぎない。
According to the Japanese government, the reason the numbers do not match is that it is difficult to isolate the exact factors behind the revision.
日本政府によれば、数字が一致しない理由は改定要因の厳密な切り分けが難しいからであるという。
However, there is no explanation as to why the rate has increased significantly only after the start of Abenomics, and on the contrary, it has decreased significantly in the 1990s.
しかし、「なぜアベノミクス開始後だけ大きくかさ上げされ、1990年代は逆に大きく引き下げられているのか」という点については、何も説明されていない。
After that, GDP was revised again in December 2020. Let's compare GDP before the 2016 revision, GDP after the 2016 revision, and GDP after the 2020 revision.
その後、2020年12月になってまたGDPが改定された。2016年に改定される前のGDP、2016年改定後のGDP、2020年改定後のGDPを並べてみよう。
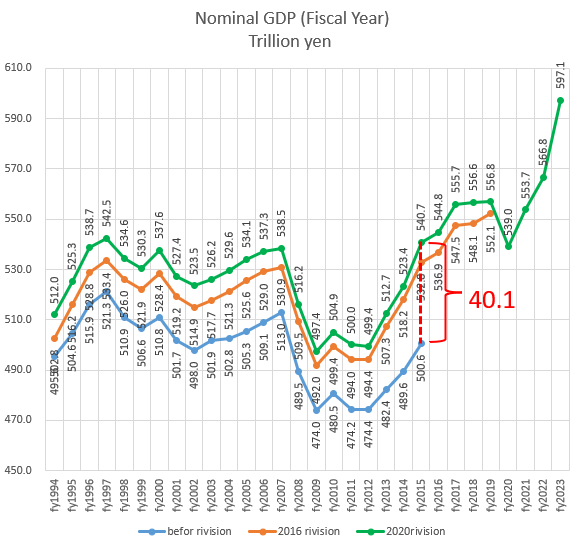
Looking at the figures for 2015, the nominal GDP before the 2016 revision was only 500.6 trillion yen, but after two revisions, it has increased by 40.1 trillion yen to 540.6 trillion yen.
2015年度の数字を見ると、2016年改定前の名目GDPは500.6兆円に過ぎなかったが、2度の改定を経て、40.1兆円も増加し、540.6兆円となっている。
Looking at real private final consumption expenditure, the approximately 306 trillion yen in fiscal 2013 is still the highest. Since then, the stock has continued to be unable to reach new highs for ten years.
実質民間最終消費支出を見ると、2013年度の約306兆円が未だに最高値である。以後10年もの間、最高値を更新できない状況が継続している。
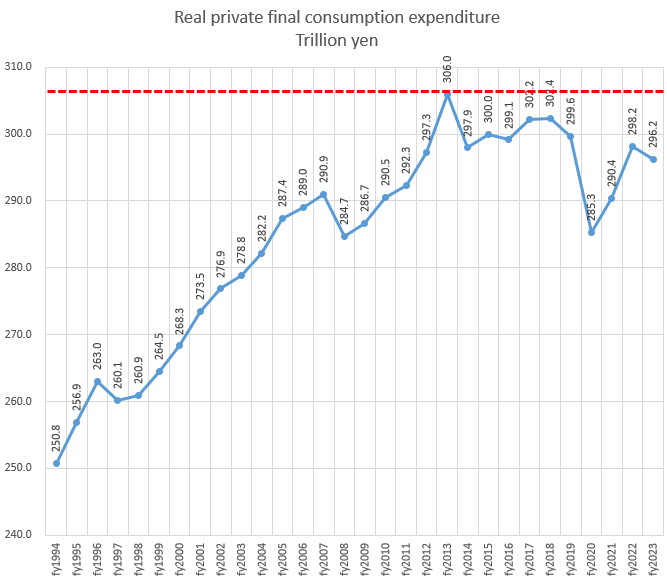
The last four years have been affected by the covid-19 pandemic. However, for the six years prior to that, real private final consumption expenditures had not reached a new high.
直近4年間は、covid-19の流行が影響している。しかし、それ以前の6年間、実質民間最終消費支出の最高値は更新されなかった。
This was the first time since the Pacific War that Japan had not been able to update its real private final consumption expenditure for six years. In other words, the worst consumption stagnation since the war had occurred.
日本が6年間も実質民間最終消費支出を更新できなかったのは、太平洋戦争後初の事態であった。すなわち、戦後最悪の消費停滞が生じていた。
And this number is after being greatly inflated by "Sonotanomics". There is no doubt that the numbers would have been even worse if they had not been raised.
そして、この数字は「ソノタノミクス」によって大きくかさ上げされた後の数字である。かさ上げしていなければ、もっと酷い数字になっていたことは間違いない。
Is Japan's currently published GDP reliable?
現在公表されている日本のGDPは信頼できるものなのだろうか?
In addition, in the most recent fiscal year 2023, both nominal GDP and real GDP are set to reach "all-time highs."
なお、直近2023年度は、名目GDP、実質GDP共に「史上最高」を記録している。
In October 2017, I published "Give my regard to Abenomics,'' which discussed the problems with Abenomics, and in it I pointed out Sonotanomics.
私は2017年10月に、アベノミクスの問題点について論じた「アベノミクスによろしく」を発行したが、その中で、ソノタノミクスを指摘した。
 (集英社インターナショナル)")
Incidentally, before this book was published, the editor in charge asked the government whether there was a breakdown of "other."
なお、この本が発行される前、担当編集者が政府に対し、「その他」の内訳は無いのか問い合わせた。
The government's response at that time was that there was "no breakdown."
その時の政府の回答は「内訳は無い」というものであった。
However, as I mentioned earlier, the government subsequently released "figures that are close to the breakdown."
ところが、先ほど述べたとおり、その後、政府は「内訳に近い数字」を公表した。
In fact, shortly before this announcement, I had been scheduled to appear on a certain BS broadcast program to talk about "sonotanomics." However, the recording of the program was postponed at the last minute, and in the meantime the "figures that are close to the breakdown" were released. The recording of the program was done after that.
実は、この公表の少し前、私はとあるBS放送の番組に出演し、「ソノタノミクス」について話をする予定であった。しかし、その番組の収録は直前になって延期され、その間に「内訳に近い数字」の公表がされた。番組の収録がされたのはその後である。
The announcement was made almost as if it was timed to coincide with my appearance on the program.
まるで私の番組出演に合わせたかのような公表であった。
When the government's statistical fraud became a hot topic in 2019, the opposition parties also took notice of Sonotanomics, and Diet member Yamai submitted a questionnaire to the government on March 20, 2019.
2019年に政府の統計不正が話題になった際、このソノタノミクスについて野党も注目し、国会議員の山井氏が2019年3月20日に政府に対して質問書を提出した。
Section 2 of this questionnaire contains the following:
この質問書の2項は次の内容である。
[With regard to "Others," there has been a significant increase only since 2013 (Abenomics) (an average of +5.6 trillion yen), and in the 1990s, on the contrary, there has been a significant decrease (an average of -3.8 trillion yen). There is no explanation, but please provide the government's opinion as to why there is such a large difference. ]
【「その他」について、2013年(アベノミクス)以降のみ大幅なかさ上げ(平均プラス5.6兆円)となり、1990年代は逆に大幅なかさ下げ(平均マイナス3.8兆円)となってしまう原因についての明示的な説明がありませんが、政府として、このような大きな差が出る理由についての見解を示して下さい。】
The government's response to this was as follows.
それに対する政府の回答は、下記のとおりであった。
[It is difficult to answer your question because it is not clear what you mean by "significant increase in height" and "significant decrease in height," but the supplementary material explains the main factors of "other" you pointed out. This is where it is explained. ]
【御指摘の「大幅なかさ上げ」及び「大幅なかさ下げ」の意味するところが明らかではないため、お尋ねについてお答えすることは困難であるが、補足資料では、御指摘の「その他」の主な要因について説明されているところである。】
This answer does not answer the question, ``Why did it increase significantly only after Abenomics, but conversely was it significantly lowered in the 1990s?''
この回答は、「なぜアベノミクス以降のみ大きくかさ上げされ、1990年代は逆に大きくかさ下げされるのか」という質問に対する回答になっていない。
The ``supplementary materials'' that the government refers to are the ``numbers that are close to the breakdown'' that I pointed out earlier. The document also does not explain the reason for the large difference.
政府の言う「補足資料」とは、先ほど指摘した「内訳に近い数字」のことである。その資料にも、大きな差がでる理由は書かれていない。
In other words, the government did not answer the reason for the large difference between post-Abenomics and the 1990s.
つまり、政府は、アベノミクス以降と1990年代で大きな差が出る理由について、回答しなかった。
In this way, Sonotanomics is an issue that was also pursued in the Japanese Diet.
このように、ソノタノミクスは、日本の国会においても追及された問題である。
I myself was called to the Diet as a public speaker and pointed out the problems. This is the video from that time.
私自身も、国会に公述人として呼ばれ、問題点を指摘した。これがその際の動画である。
However, in that year's Diet session, the issue of wage increases was the main focus, not Sonotanomics.
ただ、この年の国会においては、ソノタノミクスではなく、賃金のかさ上げ問題が主として追及されていた。
Simply put, this is a problem in which the government changed the calculation method so that wages would be calculated higher, and then connected it to past figures, making it appear that wages had skyrocketed.
これは、簡単に説明すると、賃金が高く算出されるよう、政府が計算方法を変え、それをそのまま過去の数字と接続し、賃金が急上昇したように見せかけた、という問題である。
Normally, when a calculation method is changed, revisions are made going back several years to maintain continuity with past numbers. However, the government did not do this intentionally when making the changes in 2018.
通常、計算方法を変えた場合、過去の数字との連続性を保つため、数年分遡って改定する。しかし、政府は2018年の変更の際、それをわざとしなかったのである。
As a result, nominal wages increased by 1.4% in just one year in 2018, compared to only 1.4% in the five years from 2013 to 2017. This was a five-year increase in just one year. This does not reflect the reality at all.
この結果、2013年~2017年までの5年間で1.4%しか伸びなかった名目賃金が、2018年のたった1年間で1.4%も伸びた。5年分の上昇をわずか1年で達成したのである。これは全く実態を反映していない。
In cooperation with opposition members, I attempted to pursue the Sonotanomics issue using the wage increase issue as a prelude, but due to the limited time available for deliberations in the Diet, I was unable to fully pursue the issue.
私は野党議員と協力し、この賃金かさ上げ問題を前哨戦として、ソノタノミクス問題を追及しようと試みたが、国会の審議時間の制約も影響し、十分に追及しきれずに終わった。
After that, Sonotanomics was never brought up in Congress again. This was probably due to the fact that Covid-19 countermeasures were prioritized.
その後、ソノタノミクスが国会で再度取り上げられることは無かった。これには、Covid-19対策が最優先されたことも影響したであろう。
I will once again show the graph of the adjustment amount for "Other".
もう一度、「その他」の調整額のグラフを再掲する。
This is clearly an odd adjustment to the numbers, but as far as I know this issue has never been brought up in any major Japanese media.
このように、明らかにおかしな数字の調整がされているのだが、日本の大手メディアでこの問題が取り上げられたことは、私が知る限り無い。
I decided to write this article in English because I thought that overseas media might be interested in Sonotanomics.
今回この記事を英文で書こうと思ったのは、海外のメディアであれば、ソノタノミクスに興味を持つかもしれないと考えたからである。
Japan's major media cannot be expected to report on this issue. This is because they avoid reporting that would displease the government.
日本の大手メディアがこの問題を報道することは期待できない。彼らは政府に嫌われるような報道を避けるからである。
In addition to Sonotanomics, other Japanese statistics are also subject to suspicious manipulation. The same goes for the issue of wage increases that I pointed out earlier. These are just some of the many problems surrounding Japan's statistics.
なお、このソノタノミクス以外にも、日本の統計は怪しい操作がなされている。先ほど指摘した賃金かさ上げ問題もそうである。これらは、日本の統計をめぐる多くの問題の一部に過ぎない。
According to a report by Representative Ogawa at the House of Representatives Budget Committee on February 18, 2019, since Mr. Abe became prime minister for the second time, a total of 53 statistical methods have been revised, of which 38 have an impact on GDP.
2019年2月18日衆議院予算委員会における小川議員の指摘によれば、安倍氏が2度目の総理大臣になって以降、全部で53件の統計手法が見直され、そのうち38個がGDPに影響しているという。
It is a common phenomenon for companies facing bankruptcy to falsify their financial results, and this country appears to be doing the same.
倒産しそうな会社が業績を改ざんするのはよくある現象である。この国も同じことをやっているように見える。